Causeway
From Erights
| Line 146: | Line 146: | ||
== Causeway's Trace Log Format == | == Causeway's Trace Log Format == | ||
| - | Causeway supports the [http://waterken.sourceforge.net/debug/ JSON trace file format] defined by Tyler Close. | + | Causeway supports the [http://waterken.sourceforge.net/debug/ JSON trace file format] defined by Tyler Close. |
| + | |||
| + | [[Image:event-types.png|alt=Trace log event types]] | ||
| + | |||
When causality tracing is on the events are logged as follows. | When causality tracing is on the events are logged as follows. | ||
| Line 157: | Line 160: | ||
| A message delivery, starting a new turn || Got | | A message delivery, starting a new turn || Got | ||
|- | |- | ||
| - | | | + | | Registration of a when-block || SentIf |
|- | |- | ||
| - | | A promise resolution || | + | | A promise resolution || Fulfilled or Rejected |
|} | |} | ||
Revision as of 18:02, 23 May 2010
Contents |
Causeway: A message-oriented distributed debugger
Causeway, an open source distributed debugger written in E, lets you browse the causal graph of events in a distributed computation.
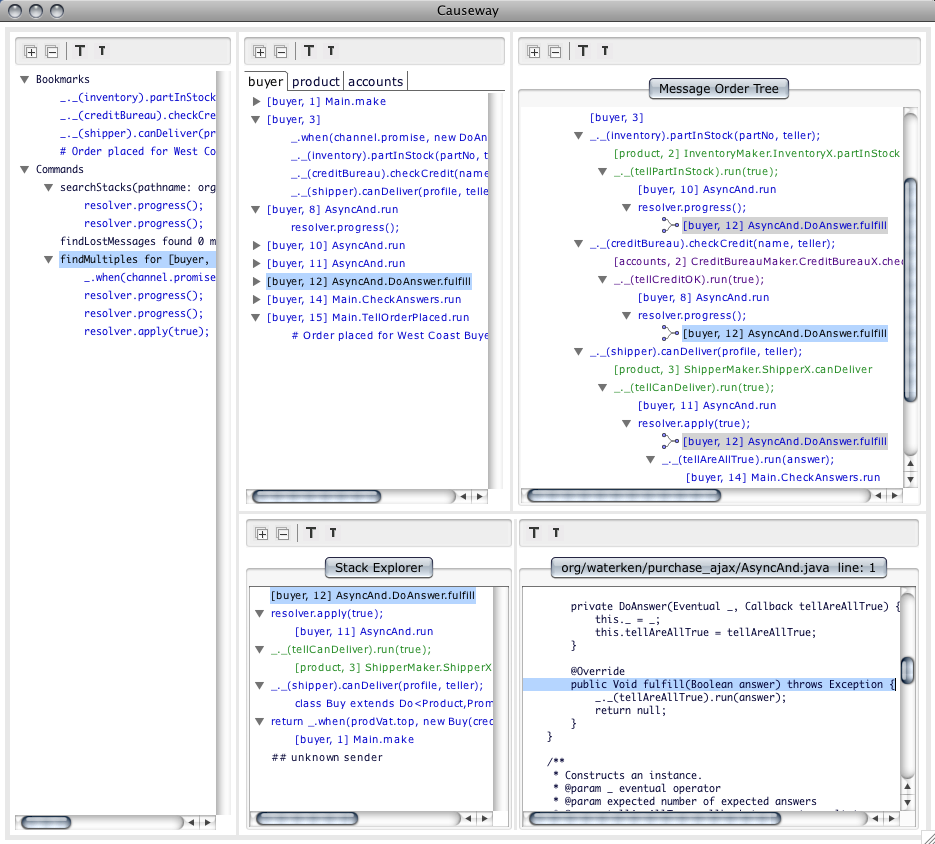
Causeway provides a post-mortem view, gathered from trace files written by the processes you wish to debug. The process-order view (top-left pane) shows the full order of events recorded by each process. This gives a "follow the process" view common to conventional distributed debuggers. In the message-order view (top-right pane) we see an alternative "follow the conversation" outline view, in which each event expands to show the events it causes.
Getting Started
The simplest way to get started is to launch Causeway from a command line shell and then open one of the examples.
$ cd e/src
$ rune -De.home=esrc esrc/scripts/causeway.e-swt
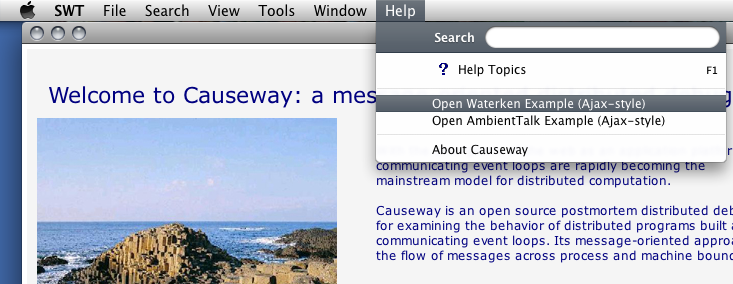
From the Welcome view select an example program from the Help menu.
Optionally, the sources and trace logs can be specified on the command line.
$ rune -De.home=esrc -Dsrc=<srcRootDir> esrc/scripts/causeway.e-swt <logs>
Java's default memory settings are sufficient for the examples but larger programs need more stack and heap space. Use the -Xss (stack) and -Xmx (heap) options to increase Java default memory sizes. Follow the amount with m for Mb or k for Kb. Notice the format does not follow the name=value convention. The J option tells rune to pass the option to Java.
-J-Xss128m -J-Xmx128m
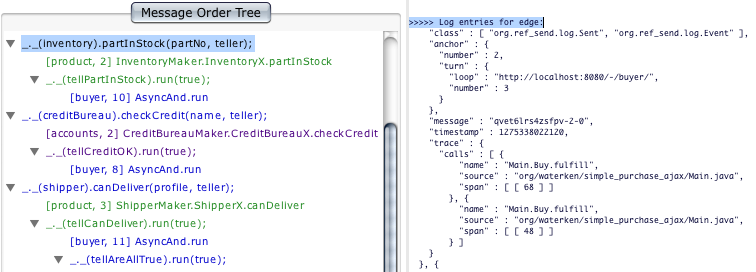
Setting Causeway's debug flag enables a Debug view. As events are selected in the viewer, the Debug view shows the corresponding trace record in the log file.
-Dcauseway_debug=true
Waterken Example (Ajax-style)
This Java program ran on the Waterken server instrumented to generate Causeway's trace log format. The program is a distributed implementation of a procedure for handling new purchase orders.
Before an order is placed, certain conditions must be met: the item is in stock and available, the customer’s account is in good standing, and the delivery options are up to date. An object residing in the “buyer” process (or vat) has remote references to objects residing in the “product” and “accounts” processes. The buyer queries the remote objects with asynchronous message sends. This example uses Ajax-style continuation-passing: a request carries a callback argument to which a response should be sent.
The screenshot below shows the principal views from Causeway's postmortem display for this example.
Causeway Viewer
- Search view (leftmost): This view lists bookmarks and results of search commands.
- Process-order view: This view lists events in chronological order, organized by vat. For example, clicking the "buyer" tab shows all events logged by the buyer vat. The events are ordered by turn number and within each turn, anchor number.
- Message-order view: This view shows the order in which events caused other events by sending messages. Message order is reflected in the outline structure: nested events were caused by the parent event. Causeway assigns each vat a color so we can see when message flow crosses vat boundaries.
- Stack Explorer and Source view: These views are familiar from sequential debugging.
Individual tree items represent events and their descriptive labels depend on the information available in the trace record for the event. Causeway labels the tree items according to the following priority.
- The "text" field string. This field is required for Comment records. It is optional for Sent, SentIf, and Resolved records.
- If the trace record has at least one stack trace with a source and span, a single line of source code from the source file specified in the top stack entry.
- If there's no span, source file name and function name specified in the top stack entry.
- If nothing else, a Causeway comment.
Menu Commands
File >> Set Source Root... point at the root directory of the sources.
For example, for the trace record pathname shown below,
"trace" : {
  "calls" : [ {
      "name" : "AsyncAnd.run",
      "source" : "org/waterken/purchase_ajax/AsyncAnd.java"
    } ]
}
set the source root to the underlined prefix.
~/Desktop/waterken/example/src/org/waterken/purchase_ajax/AsyncAnd.java
(Limitation: Cannot set multiple source roots.)
File >> Open select log files to open.
(Limitation: Cannot select a folder. Must go into the folder and select the multiple files.)
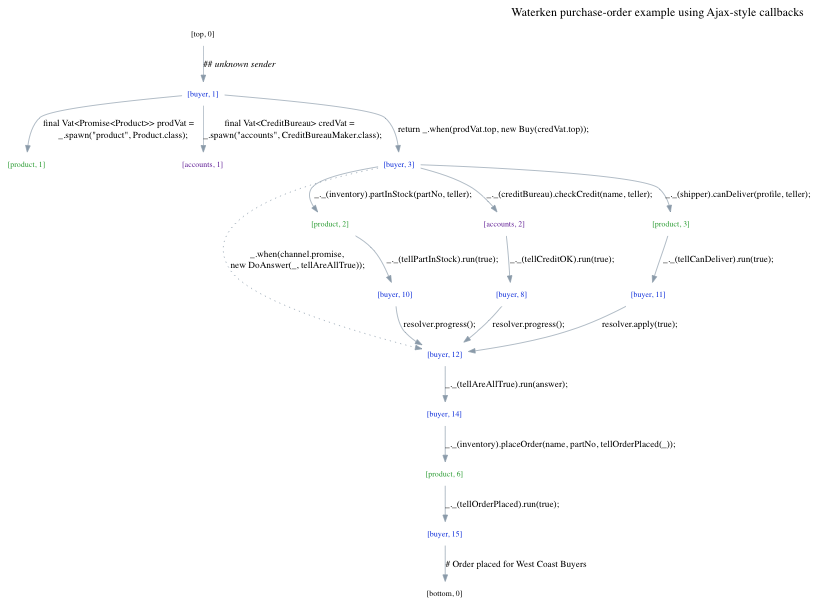
File >> Export... translates Causeway's message graph (DAG) to the GraphViz DOT format and writes the dot file to a local disk. The dot file is a human-readable text file. It specifies a graph using the DOT language. GraphViz must be downloaded and installed to see the graph visualization. The graph below was generated for the Waterken example described above.
Search >> Find Lost Messages reports sent messages that were not received. The message graph is searched for Sent or SentIf events having no corresponding Got event. Of course, the message may actually have been received, but the event was not logged.
Tools >> Set Filter Options... presents all source files seen during parsing of the trace logs. Individual files can be filtered out.
(Limitation: These settings are not persistent across launches.)
Context Menu Commands
Bookmark bookmarks the currently selected event.
Find Multiples finds the multiple causes of a joining event.
Search Stacks
(Limitation: Not all source lines ... and currently, there is no visual indication...)
Causeway's Trace Log Format
Causeway supports the JSON trace file format defined by Tyler Close.
When causality tracing is on the events are logged as follows.
| Event | Record type |
|---|---|
| An eventual send to an object | Sent |
| A message delivery, starting a new turn | Got |
| Registration of a when-block | SentIf |
| A promise resolution | Fulfilled or Rejected |
An eventual send to an object
This eventual send to an inventory object has two log entries: a Sent and its corresponding Got.
_._(inventory).placeOrder(name, partNo);
A Sent-Got pair match on message ID, a generated string which uniquely identifies a message.
[ {
    "$" : [ "org.ref_send.log.Sent", "org.ref_send.log.Event" ],
    "anchor" : {
      "number" : 1,
      "turn" : {
        "loop" : "https://y-3tideqmd4uutjcv3.yurl.net:8443/-/pp8/",
        "number" : 8
      }
    },
    "message" : "https://y-3tideqmd4uutjcv3.yurl.net:8443/-/pp8/8",
    "trace" : {
      "calls" : [ {
          "name" : "placeOrder",
          "source" : "example/src/org/waterken/purchase_promise/Inventory.java"
        }, {
          "name" : "fulfill",
          "source" : "example/src/org/waterken/purchase_promise/Buyer.java",
          "span" : [ [ 28 ] ]
        }, {
          "name" : "fulfill",
          "source" : "example/src/org/waterken/purchase_promise/Buyer.java",
          "span" : [ [ 1 ] ]
        } ]
    }
  } ]
The eventual send originated from vat pp8, turn 8, sequence number 1. The "trace" records the call stack at the point of the message send.
[ {
    "$" : [ "org.ref_send.log.Got", "org.ref_send.log.Event" ],
    "anchor" : {
      "number" : 0,
      "turn" : {
        "loop" : "https://y-3tideqmd4uutjcv3.yurl.net:8443/-/pp8/",
        "number" : 9
      }
    },
    "message" : "https://y-3tideqmd4uutjcv3.yurl.net:8443/-/pp8/8",
    "trace" : {
      "calls" : [ ]
    }
  } ]
The message was delivered to its target in vat pp8, turn 9. Being at the top of a new turn, there is no stack and the sequence number is 0.
Note: The "loop" field identifies the vat by URI. To find a short name for display, Causeway picks up the part following "/-/", in this case pp8.
An eventual send to a promise
The statement below sets up a when to execute its body, new CheckAnswers(), once a promise, allOkP, is resolved. It has three log entries: a SentIf and its corresponding Resolved and Got. The body of the when (logged as a Got) is caused by two things: setting up the when (logged as a SentIf) and fulfilling the promise that the when is waiting on (logged as a Resolved).
_.when(allOkP, new CheckAnswers());
A SentIf-Got pair match on message ID, a generated string which uniquely identifies a message. A SentIf-Resolved pair match on condition, a generated string which uniquely identifies a promise.
[ {
    "$" : [ "org.ref_send.log.SentIf", "org.ref_send.log.Sent", "org.ref_send.log.Event" ],
    "anchor" : {
      "number" : 6,
      "turn" : {
        "loop" : "https://y-3tideqmd4uutjcv3.yurl.net:8443/-/pp8/",
        "number" : 1
      }
    },
    "condition" : "m5qi5ggmjlth4clvvqmy4zbfty",
    "message" : "a7clmttrfaldeewtuecgbgbpti",
    "trace" : {
      "calls" : [ {
          "name" : "run",
          "source" : "example/src/org/waterken/purchase_promise/Buyer.java",
          "span" : [ [ 64 ] ]
        }, {
          "name" : "start",
          "source" : "example/src/org/waterken/purchase_promise/Main.java",
          "span" : [ [ 80 ] ]
        } ]
    }
  } ]
[ {
    "$" : [ "org.ref_send.log.Resolved", "org.ref_send.log.Event" ],
    "anchor" : {
      "number" : 2,
      "turn" : {
        "loop" : "https://y-3tideqmd4uutjcv3.yurl.net:8443/-/pp8/",
        "number" : 7
      }
    },
    "condition" : "m5qi5ggmjlth4clvvqmy4zbfty",
    "trace" : {
      "calls" : [ {
          "name" : "fulfill",
          "source" : "example/src/org/waterken/purchase_promise/AsyncAnd.java",
          "span" : [ [ 31 ] ]
        }, {
          "name" : "fulfill",
          "source" : "example/src/org/waterken/purchase_promise/AsyncAnd.java",
          "span" : [ [ 1 ] ]
        } ]
    }
  } ]
[ {
    "$" : [ "org.ref_send.log.Got", "org.ref_send.log.Event" ],
    "anchor" : {
      "number" : 0,
      "turn" : {
        "loop" : "https://y-3tideqmd4uutjcv3.yurl.net:8443/-/pp8/",
        "number" : 8
      }
    },
    "message" : "a7clmttrfaldeewtuecgbgbpti",
    "trace" : {
      "calls" : [ ]
    }
  } ]
See Also
Our current development effort is to generalize Causeway to support asynchronous message-passing programs running on event loop-based platforms in general, not just E. Our initial focus has been on the Waterken server.
HP Labs Technical Report presents our experience with the Waterken web server which we have instrumented to generate Causeway's language-neutral trace log format.
Screencast presents a brief demonstration of Causeway, using the example from the HP Tech Report.
Debugging a Waterken application explains how to configure the Waterken server to emit the JSON debugging records understood by Causeway.
Debugging AmbientTalk using Causeway explains how to emit Causeway debugging records, in order to use Causeway to debug AmbientTalk applications.


